What Actually Causes Bottlenecks in a Radiology Worklist
An imaging director traces slipping turnaround times to staffing gaps, STAT overuse, and manual routing — with 2026 research on each cause.
By Trisha Seal — September 23, 2026. Trisha writes about the operational mechanics behind RAD365's Radiology Workflow Manager, including intake, routing, and SLA tracking. RAD365 supports PACS infrastructure and workflow operations.
The Report That Did Not Explain Anything
The imaging director at a mid-size, multi-site radiology group opened the quarterly turnaround report expecting a clear culprit. Volume was up, but not dramatically. Headcount was flat. Nobody had left that quarter. Yet median turnaround had slipped again, for the third quarter running, and the loudest complaints were coming from the two smallest sites. Understanding radiology worklist bottlenecks meant giving up the assumption that radiologists were image access too slowly — because the data did not support it. The image access intervals had barely moved. Everything else had.
Where the Time Was Actually Going
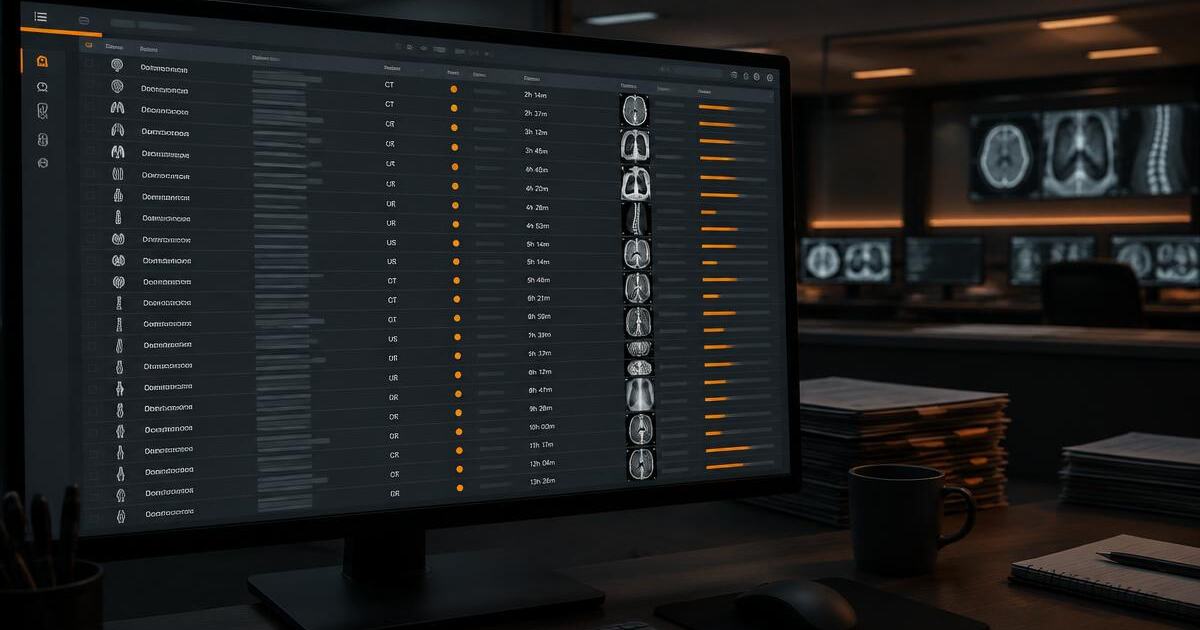
She split the delay into three intervals: receipt to assignment, assignment to open, open to signed. The third was stable. The first had nearly doubled. Cases were not waiting to be read; they were waiting to be given to someone. On Monday mornings the queue held work from Saturday afternoon that nobody had routed, and the coordinator who normally handled assignment had spent Friday evening reconciling a site's modality labels instead.
That pattern is documented. Ritchie and colleagues, writing in Current Problems in Diagnostic Radiology in 2026, identified insufficient staffing levels during evening and weekend shifts as a contributor to turnaround-time delays. Volume does not politely decline at 6pm on Friday. Coverage does, and the gap between the two accumulates into a queue that Monday inherits.
The Priority Flag That Stopped Meaning Anything
The second finding was less comfortable, because it came from outside the group. Roughly a third of incoming cases from two referring practices carried a STAT flag, and almost none of them behaved urgently once read. The same Ritchie et al. article names inappropriate or overused STAT ordering by referring providers as a source of cascading workflow delays — and the cascade is mechanical. When a third of the queue is marked highest priority, the flag no longer sorts anything. Genuinely urgent cases queue behind routine work wearing the same label, and coordinators start applying their own informal judgment, which is slower and inconsistent between shifts.
The Cost That Grew With the Group
The third cause was the group's own success. Two acquisitions in four years had produced five sites, three time zones of coverage, and a subspecialty mix that no single coordinator held in their head. Every case now required checking modality, body part, credential eligibility, who was actually on shift, and which site's contract applied. None of that is difficult. All of it is repeated, per case, several hundred times a day.
That growth is an industry pattern, not a local quirk. The ACR Bulletin's 2026 workforce update, drawing on Harvey L. Neiman Health Policy Institute data, cites a 2024 HPI study published in AJR showing the average radiology practice grew from 45 to 89 physicians between 2014 and 2023 as practices consolidated. Consolidation concentrates scheduling and routing complexity in exactly the way this group had experienced it — more combinations resolved through one queue, still largely by hand. Automated case routing by modality and body part exists because that matching work is deterministic and repetitive, which makes it a poor use of a coordinator's shift.
The Trend That Makes It Urgent
The same ACR Bulletin update reports that radiologists are now leaving practice at over twice the rate compared with less than 10 years ago. For the director, that reframed the whole exercise. Operational waste had always been tolerable because capacity could be added. If departures outpace recruitment, every minute lost to searching, reassigning, and coordinating is absorbed by a smaller group of people — and the case for fixing the operational layer stops being an efficiency argument and becomes a capacity one.
What the Three Causes Look Like Side by Side
| Cause | Where the delay shows up | What addresses the operational part |
|---|---|---|
| Uneven shift coverage | Weekend and overnight queue inherited by the next shift | Availability scheduling that accounts for time zones and active coverage |
| STAT-order overuse | Priority signal loses sorting value; manual triage returns | Source-level visibility into STAT volume and its actual behavior |
| Manual matching overhead | Receipt-to-assignment interval grows with sites and rules | Rule-based routing by modality, body part, and eligibility |
| Fragmented intake | Separate queues per referral source, each managed by hand | Automated intake normalizing multiple sources into one workflow |
What a Connected Workflow Layer Changes — and What It Does Not
A connected workflow layer addresses the operational portion of that delay and nothing more. Automated intake brings multiple referral sources into a single queue. Routing applies modality and body-part rules so eligibility is established before workload is balanced. Time-zone-based availability scheduling lets the qualified pool shift as coverage moves. An institution self-service portal removes a share of the coordination calls that interrupt the same staff doing the routing. Automated SLA tracking turns queue management into exception handling, so attention goes to cases approaching a threshold rather than to re-image access the whole list.
There is a documented upper bound on what restructuring can achieve on the reporting side, too: the Ritchie et al. 2026 CPDR article describes one institution that transitioned to subspecialized reporting and cut median turnaround from 49.1 hours in 2015 to 15.2 hours in 2018, completing more reports within two hours while handling higher scan volumes. That is one institution's result from a structural change, not a rate any group should assume.
RAD365 reports its own customer outcomes separately: 40–60% faster turnaround, 25–35% higher radiologist productivity, 90% less administrative time, and 100% SLA compliance across Radiology Workflow Manager deployments. Those are RAD365's figures, not findings from the research above, and the two should not be read as the same kind of evidence. Where the underlying constraint is infrastructure rather than coordination — retrieval latency, interface failures, archive performance — the answer sits with managed PACS operations instead, and documented support tiers and SLAs are what make that distinction actionable.
What the Director Did Next
She instrumented before automating. For six weeks the group tracked time-to-assignment, reassignment rate, unassigned aging by shift, STAT share by referring source, and after-hours queue depth. The measurements confirmed what the three intervals had suggested — the constraint lived between arrival and assignment — and gave her something concrete to take to the two referring practices about their STAT rate. Neither conversation would have been possible with an anecdote.
RAD365 is an operations and workflow partner. RAD365 supports PACS infrastructure and workflow operations. Every clinical decision described here stays with the radiologists.
Find Out Where Your Worklist Actually Stalls
Review intake, routing, availability scheduling, and SLA tracking against the delays showing up in your own turnaround data.
Explore the Radiology Workflow Manager →Frequently Asked Questions
Where Bottlenecks Come From
What actually causes bottlenecks in a radiology worklist?
Rarely a single cause. The recurring ones are operational: staffing coverage that does not match when volume arrives, priority signals that stop distinguishing urgent work, manual assignment overhead that grows with case volume, and queue structures that fragment by source rather than by need. image access speed is usually the last place the problem sits, not the first.
Is a growing worklist the same thing as a bottleneck?
No. Volume growth raises the floor; a bottleneck is a specific point where cases wait for something other than image access time. The test is where the time accumulates. If cases sit unassigned, or sit assigned to someone unavailable, or sit behind a flood of same-priority work, the constraint is operational rather than clinical capacity.
How does uneven shift coverage create turnaround delays?
Ritchie and colleagues, writing in Current Problems in Diagnostic Radiology in 2026, identified insufficient staffing levels during evening and weekend shifts as a contributor to turnaround-time delays. Volume does not fall at the same rate coverage does, so the queue built overnight or over a weekend has to be absorbed by a daytime shift already carrying its own work.
Does STAT ordering really affect worklist throughput?
Yes. The same Ritchie et al. 2026 article points to inappropriate or overused STAT ordering by referring providers as a source of cascading workflow delays. When a large share of the queue carries the highest priority flag, the flag stops functioning as a triage signal, and genuinely urgent cases compete with routine work that was simply labeled urgent.
Why does manual case assignment get more expensive as a group grows?
Because the matching work scales with the product of cases and constraints, not with cases alone. Each additional site, modality mix, credential rule, and time zone multiplies the checks a coordinator performs per case. A process that is manageable for one location becomes a measurable daily cost across several.
Workforce and Consolidation Pressure
How is the radiologist workforce trend affecting worklist pressure?
The ACR Bulletin's 2026 workforce update, drawing on Harvey L. Neiman Health Policy Institute data, reports that radiologists are now leaving practice at over twice the rate compared with less than 10 years ago. Departures remove capacity faster than recruitment replaces it, which makes each remaining radiologist's time a more consequential resource and raises the cost of operational waste in the queue.
Has practice consolidation changed how complex scheduling is?
Substantially. A 2024 HPI study published in AJR, cited in the same ACR Bulletin update, found the average radiology practice grew from 45 to 89 physicians between 2014 and 2023. Larger practices concentrate scheduling and routing complexity: more subspecialty combinations, more sites, more contracts, and more shift patterns resolved through one queue.
Does subspecialized reporting help or hurt turnaround time?
The Ritchie et al. 2026 CPDR article describes one institution that transitioned to subspecialized reporting and reduced median turnaround from 49.1 hours in 2015 to 15.2 hours in 2018, with more reports completed within two hours and higher scan volumes handled. That was a single institution's restructuring, so it shows what is achievable rather than a rate any group should expect by default.
Why does attrition make routing efficiency matter more than it used to?
When capacity was easier to add, an inefficient queue could be offset by hiring. With departures running at more than twice the earlier rate, the same inefficiency is absorbed by fewer people. Minutes lost per case to searching, reassignment, and coordination now compound against a smaller pool.
What a Connected Workflow Layer Changes
What does a connected workflow layer actually do to a worklist?
It removes repetitive operational steps between a study arriving and a qualified, available radiologist seeing it. Automated intake pulls cases from multiple referral sources into one queue, routing applies modality and body-part rules, availability scheduling accounts for time zones, an institution self-service portal reduces inbound coordination calls, and SLA tracking makes aging visible before it becomes a breach.
Which part of the bottleneck can workflow software not fix?
The clinical part. It cannot read faster, cannot decide what a study shows, and cannot manufacture capacity that does not exist. If a group is genuinely short of image access hours for its volume, better routing reduces waste around that shortage but does not remove it. Workflow tooling addresses the operational portion of the delay only.
Does automated routing reduce STAT-order overuse?
Not directly — that is a referring-provider and governance problem. What a workflow layer can do is make the pattern visible: which sources generate STAT volume, how much of it behaves urgently, and what it costs the queue. That evidence is usually what makes an ordering conversation productive instead of anecdotal.
How does time-zone-based availability scheduling help coverage gaps?
It lets the eligible pool for a case change as coverage moves across regions, without rebuilding the routing rules each shift. Evening and weekend gaps are partly a distribution problem rather than a pure headcount problem, and scheduling that understands where active coverage currently sits addresses the distribution side of it.
What does SLA tracking add that a normal worklist view does not?
A normal view shows what is waiting. SLA tracking shows what is waiting against a commitment, which turns queue management into an exception process. Operations staff act on the cases approaching a threshold rather than re-image access the whole list to judge what matters.
What results has RAD365 reported from its own customers?
RAD365 reports 40–60% faster turnaround, 25–35% higher radiologist productivity, 90% less administrative time, and 100% SLA compliance across Radiology Workflow Manager deployments. These are RAD365's own reported customer outcomes and are deliberately kept separate from the external research cited elsewhere in this article.
Scope and Getting Started
Where is the line between workflow orchestration and clinical clinical documentation?
Orchestration decides which cases reach which qualified, available radiologist, in what order, against what commitment. clinical documentation is the radiologist's clinical judgment about what the study shows. RAD365 operates entirely on the orchestration side. RAD365 supports PACS infrastructure and workflow operations.
How would a group know whether its bottleneck is operational or clinical?
Measure the intervals separately: receipt to assignment, assignment to open, open to report signed. If the first interval carries most of the delay, the constraint is operational. If the last one does, it is image access capacity or reporting workflow. Most groups have never separated the three and assume the delay sits in image access.
What is a realistic first step for a group with slipping turnaround?
Instrument before automating. Capture time-to-assignment, reassignment rate, unassigned aging by shift, STAT share by referring source, and after-hours queue depth for a few weeks. That data identifies which of the causes above is actually dominant, so the change made is the one that addresses the real constraint.
Related Services and image access
- Radiology Workflow Manager features and outcomes
- Radiology administrative and coordination support
- Managed PACS operations behind the worklist
- Support tiers, SLAs, and incident ownership
- Peer review and quality-assurance workflow
Sources
- ACR Bulletin. “The Radiologist Shortage: A Workforce Update from HPI,” 2026, using Harvey L. Neiman Health Policy Institute data. Read the ACR Bulletin update.
- Ritchie et al. Current Problems in Diagnostic Radiology, 2026 — staffing coverage, STAT ordering, and subspecialized reporting turnaround findings. View the article.
