Why Surge Volume Breaks Radiology Worklists That Look Fine on a Normal Day
A radiology worklist that runs fine on a normal day can break under surge volume. Real data shows why routing and prioritization matter as much as staff.
By Trisha Seal — October 5, 2026. Trisha writes about case routing, worklist design, and turnaround operations drawn from RAD365's Radiology Workflow Manager work for hospitals, imaging centers, and multi-site networks. RAD365 supports PACS infrastructure and workflow operations.
Most days, a radiology worklist looks fine. Cases arrive, staff pick them up, and turnaround stays inside its targets. The trouble is that "fine on a normal day" says very little about how that same radiology worklist behaves when volume suddenly doubles or triples. The scenario below is an illustrative composite, not a specific institution, but the data woven into it is real and published.
A Normal Evening, Then the Surge
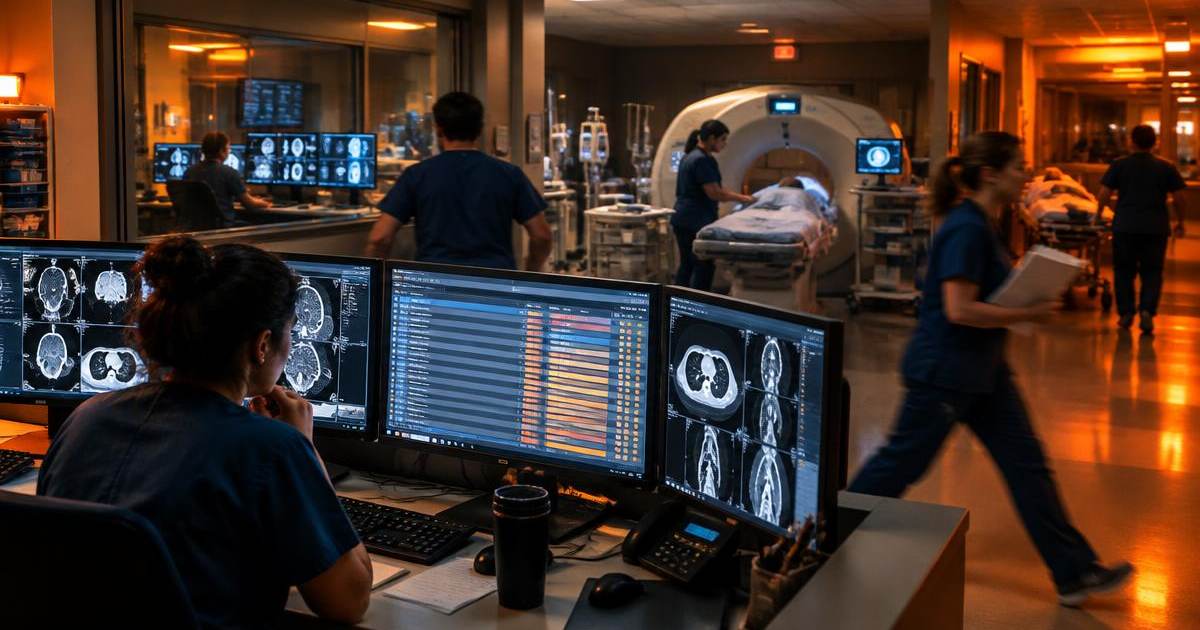
Picture a mid-size regional hospital's imaging department on a flu-season Friday. At 6 p.m., the worklist is steady. A coordinator assigns cases from memory, a few radiologists pull studies they know they can finish, and the emergency department queue clears every hour or so.
By 9 p.m., the emergency department is full. A nearby facility has an equipment outage and starts sending patients over. Orders arrive from three sources at once: the emergency department, inpatient floors, and transferred patients from the other site. Within an hour, the queue holds several times its usual volume.
What Breaks First
The first thing to fail is not the people. It is the informal system around them. Intake splits across separate queues, so nobody sees the true backlog. The first-in, first-out habit buries a critical CT behind a stack of routine chest radiographs. Two radiologists open the same study while another sits untouched. The coordinator, who managed fine at normal volume, becomes the bottleneck. These are the same structural problems we describe in what actually causes bottlenecks in a radiology worklist, just compressed into a few hours.
This Is Not Only a Surge-Day Problem
The surge lands on a system that is already strained. The Harvey L. Neiman Health Policy Institute analyzed Medicare fee-for-service claims for 2.6 million office and hospital outpatient imaging studies and found that clinical documentation turnaround time rose 113% nationally between 2014 and 2023. The increase was not steady. Turnaround stayed flat from 2014 to 2021, then 19% of the total increase arrived in 2022 and 68% arrived in 2023 alone, a hockey-stick pattern.
The rise was uneven by modality: CT turnaround rose 318%, MR rose 256%, ultrasound rose 140%, and radiography/fluoroscopy rose 63%. When a department starts a surge night with less slack than it had a few years ago, the margin for informal worklist management disappears quickly.
What a Documented Surge Actually Shows
A published 2026 Radiology study of a mass-casualty imaging response offers a rare, data-backed look at an extreme surge. Within 24 hours, 673 injured patients arrived, and 461 of them (68.5%) needed imaging. The department performed 739 radiographic exams and 179 CT exams in that window, peaking at roughly 70 radiographs and 16 CT scans per hour.
Staffing surged about fourfold. A normal weekend shift of 1 resident, 2 attendings, and 5 technologists grew to 20 technologists, 2 residents, 7 on-site attending physicians, and 5 remote attendings. CT performance improved dramatically: order-to-completion time fell from 54 minutes to 28 minutes, and CT report turnaround fell from 59 minutes to 22 minutes.
Radiography told a different story. Even with all that added staff, radiography order-to-completion time rose slightly, from 43 to 49 minutes. CT was very likely the deliberate priority for the most critical patients, while radiography absorbed far higher volume. The lesson is clear: adding people helps, but prioritization and routing decide where that capacity goes.
Normal Day vs. Surge Day
| Dimension | Normal-volume day | Surge day |
|---|---|---|
| Intake | Separate queues are manageable | Separate queues hide the true backlog |
| Prioritization | First-in, first-out mostly works | Urgent cases get buried without explicit rules |
| Assignment | A coordinator assigns from memory | The coordinator becomes the bottleneck |
| Visibility | Leaders can scan the list | Real-time status by case and SLA is essential |
| Staffing | Routine shift covers demand | Extra staff help only if routing directs them well |
Back to the Composite Friday Night
Now replay the same evening with a structured workflow layer. Every order, regardless of source, lands in one consolidated queue. Routing rules send each case to an available, qualified reader by modality and body part, the approach explained in how subspecialty case routing works. Priority rules move the critical CT ahead of routine films automatically. A live dashboard shows which cases are approaching their turnaround targets, so the department lead can shift capacity before a backlog forms. When the network spans several sites, the same logic supports balancing radiologist workload across locations.
Predictable surges, such as flu season and weekend emergency peaks, also belong in scheduling plans. The back-office side matters too; dedicated radiology admin support keeps intake clean when volume spikes.
What a Surge-Resilient Workflow Layer Needs
The pattern holds whether the spike comes from a mass-casualty event, a flu-season weekend, or an outage that reroutes volume to one site. A resilient workflow needs consolidated intake, modality- and body-part-aware routing, and real-time SLA visibility. RAD365's Radiology Workflow Manager is built around exactly those three capabilities, so the worklist that looks fine on a Tuesday holds up on the busiest night of the year.
RAD365 is an operations and workflow partner providing PACS Support and the Radiology Workflow Manager only. RAD365 supports PACS infrastructure and workflow operations.
Frequently Asked Questions
Why Worklists Break Under Surge
Why do radiology worklists that work fine on a normal day fail during a volume surge?
On a normal day, informal habits such as staff picking the next case or a coordinator assigning by memory keep up with volume. During a surge, those habits stop scaling: urgent cases get buried, work is duplicated or skipped, and nobody has a clear view of what is waiting.
What actually counts as a "surge" in imaging volume for a radiology department?
A surge is any spike in incoming studies that exceeds the department's normal capacity for a period of time. Examples include mass-casualty events, flu-season weekends, emergency department spikes, and outages at another site that push volume to one location.
Is imaging turnaround time getting worse industry-wide, or is this only a surge-day problem?
It is getting worse industry-wide. The Harvey L. Neiman Health Policy Institute found that imaging clinical documentation turnaround time rose 113% nationally between 2014 and 2023, with most of that increase happening in 2022 and 2023. Surges add pressure to a system that is already strained.
Which imaging modalities are most affected when case volume spikes suddenly?
Nationally, the Neiman HPI analysis found turnaround rose most for CT (318%) and MR (256%), followed by ultrasound (140%) and radiography/fluoroscopy (63%). In a documented mass-casualty surge, high-volume radiography was the modality whose order-to-completion time worsened despite added staff.
What a Real Documented Surge Looks Like
What does a real, documented mass-casualty imaging surge look like in practice?
A published 2026 Radiology study described 673 injured patients arriving within 24 hours, 461 of whom (68.5%) needed imaging. The department performed 739 radiographic exams and 179 CT exams in that window, peaking at about 70 radiographs and 16 CT scans per hour.
Does adding staff during a surge guarantee faster turnaround across every modality?
No. In the published mass-casualty study, staffing rose roughly fourfold, yet radiography order-to-completion time still rose from 43 to 49 minutes, even as CT times improved sharply. Staffing helps, but prioritization and routing decide where that capacity goes.
Why did CT turnaround improve during a documented surge while radiography turnaround did not?
The study reported CT order-to-completion falling from 54 to 28 minutes and CT report turnaround from 59 to 22 minutes. CT was likely the deliberate priority for the most critical patients, while radiography absorbed far higher volume, which points to triage and routing as the differentiator.
How much can on-duty imaging staffing need to increase during a true volume surge?
In the documented mass-casualty response, a normal weekend shift of 1 resident, 2 attendings, and 5 technologists grew to 20 technologists, 2 residents, 7 on-site attending physicians, and 5 remote attendings, roughly a fourfold increase.
Where Worklists Fail Structurally
Is a worklist bottleneck during a surge usually a staffing problem or a routing problem?
Usually both, but routing is often underestimated. Extra staff cannot help if cases are not reaching the right person in the right order. The mass-casualty data shows that even with four times the staff, one modality still slowed down.
How does case prioritization change, or fail to change, during high-volume periods?
Ideally, priority rules tighten so critical cases move first. In practice, manual worklists often keep a first-in, first-out pattern, so urgent studies wait behind routine ones until someone notices.
What role does routing by modality and body part play when volume spikes?
Routing by modality and body part sends each case to a qualified, available reader automatically, so a spike in one study type does not stall the whole queue and subspecialty cases do not wait for manual reassignment.
Why do manual worklist assignments cope with routine volume but collapse under a spike?
Manual assignment depends on a coordinator's attention and memory. At normal volume that works; when cases arrive several times faster, the coordinator becomes the bottleneck and errors such as duplicates and missed cases rise.
Building Surge-Resilient Radiology Workflows
What should a radiology workflow system do differently during a volume spike?
It should consolidate intake into one queue, apply priority and routing rules automatically, show real-time status for every case, and flag cases at risk of missing their turnaround targets.
Can automated SLA tracking help a department catch surge-related slowdowns earlier?
Yes. Automated SLA tracking shows which cases are approaching or past their targets in real time, so leaders can redirect capacity before a backlog grows instead of discovering it afterward.
How does consolidating case intake from multiple sources help during volume spikes?
When cases arrive from several sites, modalities, and systems, separate queues hide the true backlog. A single consolidated intake shows total volume and lets routing rules balance work across available staff.
Should radiologist scheduling account for predictable surge periods like flu season or weekends?
Yes. Predictable surges such as flu season, holidays, and weekend emergency peaks can be planned for with adjusted schedules and on-call coverage, so the department is not relying only on last-minute calls.
What should imaging leaders review after a surge event to prepare for the next one?
Review turnaround by modality, where cases waited longest, how priorities were applied, which assignments were manual, and whether staff had real-time visibility. Use those findings to update routing rules and surge playbooks.
Is surge-driven backlog preventable, or only manageable once it starts?
Some backlog is unavoidable during a true surge, but much of it is preventable. Clear priority rules, automated routing, and real-time visibility keep a spike from turning into a prolonged backlog.
Related Services and image access
- Radiology Workflow Manager for routing and SLA visibility
- Back-office radiology admin support
- Common causes of worklist bottlenecks
- Time-zone-based scheduling and turnaround
